The Geography of Well-Being
A new index takes a holistic look at America’s inequalities. Yes, that’s plural.
- RICHARD FLORIDA
- Apr 23, 2015

Economic growth has long been the basic metric through which we evaluate economic and social progress. But a growing number of policymakers and experts argue that we need a better way to measure “well being.”
In a report released today, the Social Science Research Council’s Measure of America project takes a crack at it with their own metric. Inspired by the UN’s influential Human Development Index for nations, their American Human Development Index develops measures of well-being for America’s 435 congressional districts (plus Washington, D.C.). This allows us to see how patterns of uneven and unequal socio-economic well-being exist not just between but within many of America’s largest metros. The overall index is based on three key dimensions of well-being:
- A long and healthy life, as measured by life expectancy at birth.
- Access to knowledge, based on school enrollment for people ages 3 to 24 (weighted one third) and educational degree attainment for those 25 and older (weighted two-thirds).
- Standard of living, based on median earnings for full- and part-time workers 16 and older.
The overall American Human Development Index is graded on a one to ten scale, with ten being the highest score.
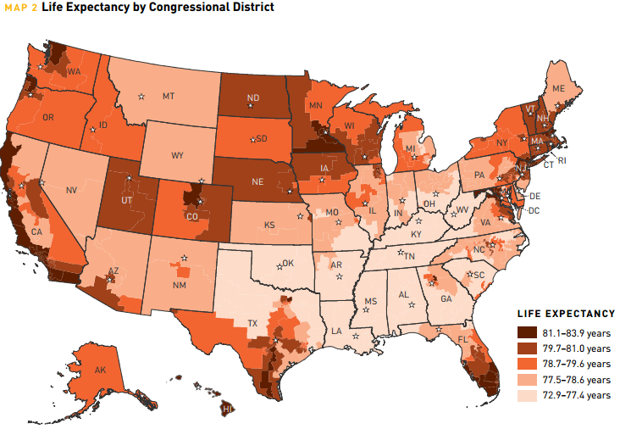
The first map shows the pattern for life expectancy, their measure of a long and healthy life. The districts where residents live the longest are in dark red, while those where residents have a lower life expectancy are in palest pink.
Life expectancy, which sits at 79 years nationwide, has grown dramatically over the past 60 years—an increase of four years since 1990 and a full ten years since 1960, as the report points out. But as the map shows, life expectancy remains extremely uneven across the country. In sections of Mississippi, West Virginia and Kentucky, life expectancy remains at 73 years of age, about the same as it was for the nation as a whole in 1980. Indeed, large swaths of the South—25 counties in all—have a life expectancy at least three years under the national average.

Life expectancy is far greater in the Northeast corridor, along the West Coast of California, in retirement areas along Florida’s southern coast, in Seattle, suburban Dallas, and around Denver and Boulder, Colorado. In these places, people can expect to live up to eight years longer than the national average. As the report points out, there’s a particularly high concentration of long-lived folks around Los Angeles, New York, Oxnard-Thousand Oaks, San Francisco, San Jose and Washington, D.C. In California’s District 18, around San Jose, residents live to a nationwide high of 84 years old.
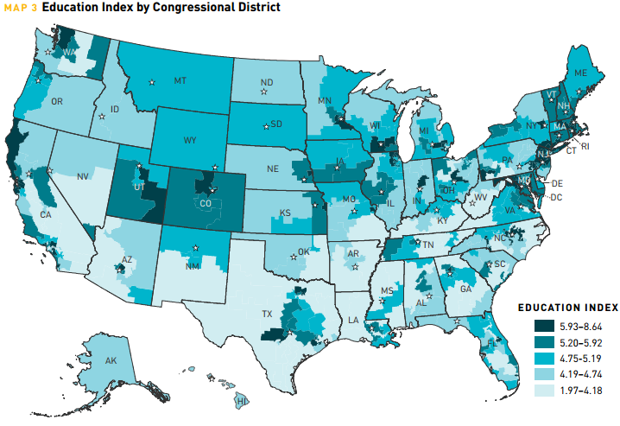
The second map charts access to knowledge, based on indicators of school enrollment and educational attainment.

Once again, the areas of highest knowledge access are concentrated in parts of L.A., the San Francisco Bay Area, and Seattle in the West; the Boston-New York-D.C. corridor in the east; Orem and Provo in Utah; Dallas and Houston in Texas; the Twin Cities of Minneapolis-St. Paul; Denver and Boulder; and in the suburbs of Detroit. Many of the smaller districts that rank highly in this education index are, unsurprisingly, college and university towns.
But as the map shows, the largest education gaps are in parts of the very same large metros. Of the ten congressional districts that rank the lowest on this knowledge access index, half are in California, concentrated either around Los Angeles or in agricultural sections mid-state. A district in the Bronx also makes the list, along with portions of Las Vegas, Phoenix, Houston and Dallas.
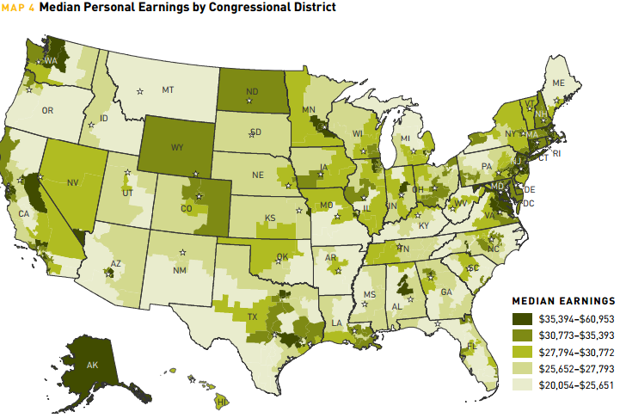
The third map shows the standard of living based on median earnings of full- and part-time workers.

Median earnings by congressional district also vary substantially. Again, we see a bicoastal pattern, with the highest earnings along the Northeast corridor and in the San Francisco Bay Area, Greater Los Angeles and Seattle. The districts with the lowest median earnings cover large areas of Sunbelt, from Deep South of Missouri, Arkansas, Louisiana, Mississippi and Florida to the western areas of New Mexico and Texas.
The gap in earnings is considerable and divides exist not only between regions and metros but within. One of the districts with the lowest earnings ($20,100 annually) is California’s 34th, which covers downtown L.A. That’s just a few miles from California’s 33rd, where a median income of $51,300 puts it in the top ten earning districts in the country. The average resident earns more than $40,000 in just 45 congressional districts, while in 222 districts, the median pay is between $20,000 and $30,000 annually. As the report notes, “the distribution of earnings between these two extremes is heavily skewed toward the lower end.”
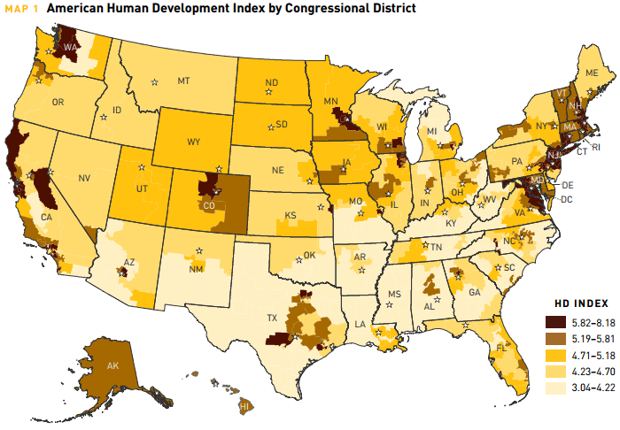
The fourth and final map charts the pattern for the overall American Human Development Index, a composite of the three sub-measures.

Again, we see a bicoastal pattern, with the highest-ranking areas along the Northeast corridor and around Los Angeles, San Francisco, Seattle, Denver and Boulder in the West, the Twin Cities, Milwaukee and Chicago in the Midwest, and Phoenix, Dallas and Houston in the Sunbelt. Notably, among the top 20 highest-scoring congressional districts, only one—Texas’s 3rd District, a suburb of Dallas —is outside of the East and West Coast states. Additionally, the top ten congressional districts for human development are all in greater metropolitan areas, which, as the report points out, attract high-skill, high-knowledge workers and draw substantial private and public investment.
Meanwhile, the lowest-ranking districts mainly span large sections of the South, from Tennessee and Kentucky through the Carolinas and Georgia, down to Arkansas and Missouri, and over to parts of Oklahoma and Texas. Southern New Mexico ranks low on the human development index, as well.
But there are also large gaps within some of the most advanced states. California, for example, contains the district with the highest overall well-being score—District 18 in the Bay Area, where 93 percent of residents have a high school diploma, median annual income is $55,200, and residents can expect to live nearly 84 years—and the district with the overall lowest, District 21, in the agricultural center of the San Joaquin Valley. There, just 59 percent of residents have high school diplomas, median annual income is $20,100, and residents live to an average 78.4 years old. “Gaps in human development within states tend to be bigger than the gaps between states,” the report authors write.
The report shows how America’s yawning inequality extends beyond just money to wide discrepancies in health, knowledge and education, too. As Stanford economist Rebecca Diamond has suggested [PDF], inequality of well-being compounds earnings inequality. Her research finds that more well-off and high-skilled Americans accrue additional benefits from living in neighborhoods with better schools, less crime and enhanced public services. Meanwhile, the less skilled and moneyed Americans are shunted off to communities with low quality schools and services. America’s economic divide registers not just in what we can afford to buy, but in the education we have the opportunity to attain and, most basically, in how much time we have to live.
Top image: SSRC/Aarian Marshall
Fonte: https://www.citylab.com/work/2015/04/the-geography-of-well-being/391188/


